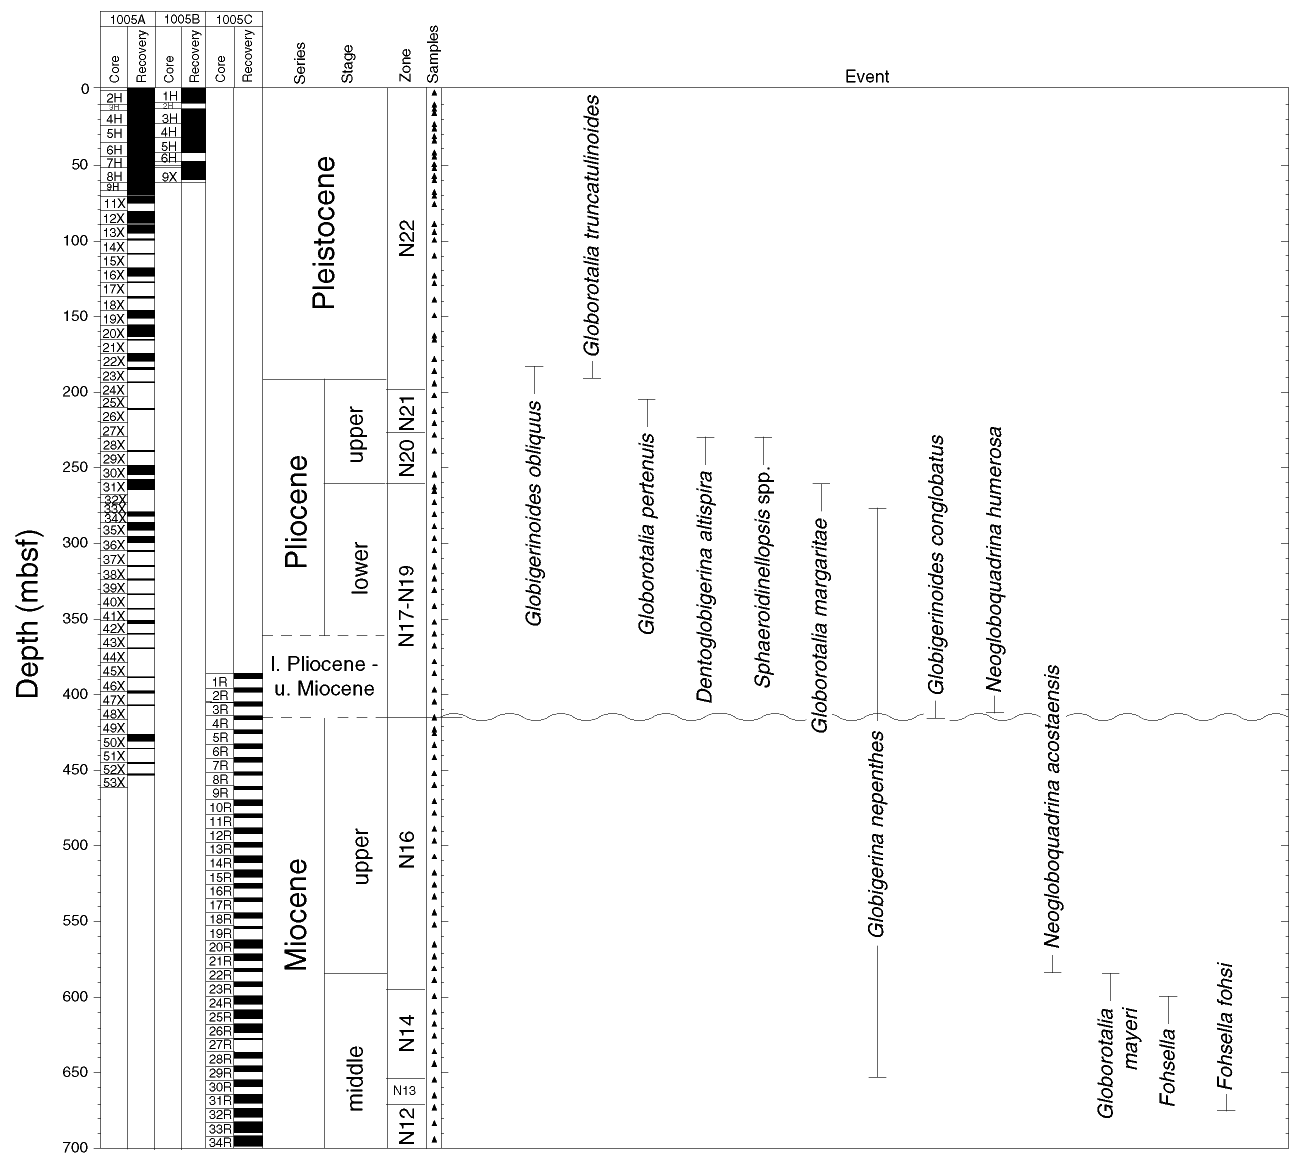
Figure 4. Planktonic foraminiferal zonation for Site 1005. Core recovery is indicated by the black shading. Sampling levels for the biostratigraphic analysis are indicated by the triangles. The first and last occurrence of indicator species are shown in the right panel.

![]()