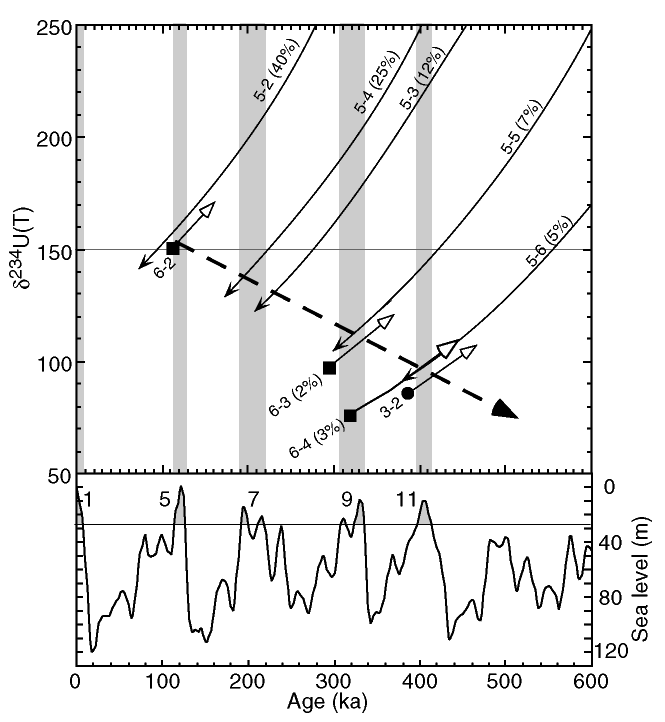
Figure
3. ![]() 234U(T)
vs. age plot for nine of the samples from this study that are thought to have
undergone U loss or gain. Filled symbols represent the measured values and are
off the figure for Site 1005 samples. Curves are labelled with sample
identifiers and are derived by progressively subtracting/adding U from/to the
measured (230Th/238U)
ratio. The lower panel shows an approximation of sea-level constructed by
scaling the marine-oxygen isotope curve (Imbrie et al., 1984) so that the most
recent deglaciation corresponds to 120 m of sea-level rise. Because the oxygen
isotope curve also contains a temperature component, this is not an accurate
indicator of past sea level but it is useful to highlight the times in the past
at which sea level has come close to its present-day value. These periods are
indicated by gray shading and marine-isotope-stage numbers on the lower panel,
and gray bars on the upper panel. Because the samples are known to have formed
during sea-level highstands, the intersection of the sample curves with
highstand intervals enables each sample to be corrected for U loss or gain and
assigned to a highstand event (see text for full discussion). All five samples
from Site 1005 showed loss of U, with the uppermost sample having lost the most
(percentage loss is shown after the sample identifier). The remaining four
samples showed slight U gain. The intersections between the curves and highstand
events define a broad trend toward lower
234U(T)
vs. age plot for nine of the samples from this study that are thought to have
undergone U loss or gain. Filled symbols represent the measured values and are
off the figure for Site 1005 samples. Curves are labelled with sample
identifiers and are derived by progressively subtracting/adding U from/to the
measured (230Th/238U)
ratio. The lower panel shows an approximation of sea-level constructed by
scaling the marine-oxygen isotope curve (Imbrie et al., 1984) so that the most
recent deglaciation corresponds to 120 m of sea-level rise. Because the oxygen
isotope curve also contains a temperature component, this is not an accurate
indicator of past sea level but it is useful to highlight the times in the past
at which sea level has come close to its present-day value. These periods are
indicated by gray shading and marine-isotope-stage numbers on the lower panel,
and gray bars on the upper panel. Because the samples are known to have formed
during sea-level highstands, the intersection of the sample curves with
highstand intervals enables each sample to be corrected for U loss or gain and
assigned to a highstand event (see text for full discussion). All five samples
from Site 1005 showed loss of U, with the uppermost sample having lost the most
(percentage loss is shown after the sample identifier). The remaining four
samples showed slight U gain. The intersections between the curves and highstand
events define a broad trend toward lower ![]() 234U(T)
with increasing age as indicated by the dashed arrow. This is due to alpha
recoil of 234U
from the U-rich aragonite material analyzed here. Of the nine samples not on
this figure, four yielded Holocene ages and five were sufficiently old that no
useful age information could be gleaned from the U-Th system.
234U(T)
with increasing age as indicated by the dashed arrow. This is due to alpha
recoil of 234U
from the U-rich aragonite material analyzed here. Of the nine samples not on
this figure, four yielded Holocene ages and five were sufficiently old that no
useful age information could be gleaned from the U-Th system.

![]()