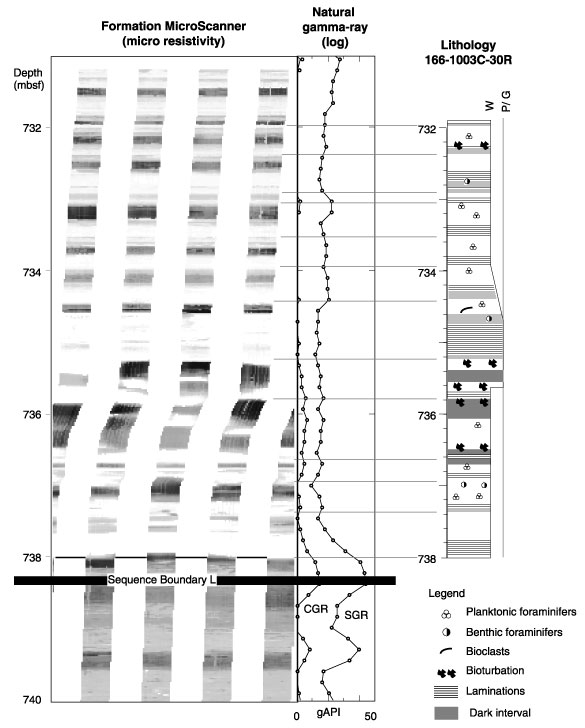
Figure 3. Part of the Formation MicroScanner (FMS) image and the lithology log (Site 1003) across a seismic-sequence boundary. The rhythmic high-frequency sedimentary cycles are interrupted by highly resistive beds (white color in the FMS image). The laminations in the lithology log were interpreted as turbidite deposits and were correlated to the resistive beds in the FMS. CGR = computed gamma ray, SGR = standard gamma ray. W = wackestone, P = packstone, G = grainstone.
![]()