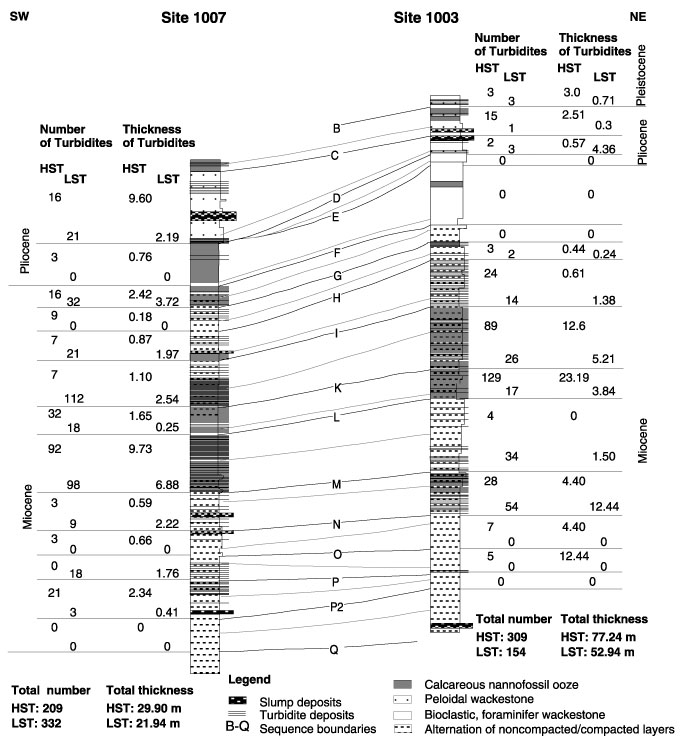
Figure 5. The distribution of turbidite deposits at Sites 1007 and 1003 displaying thickness and number of turbidites deposited during sea-level highstands. The dotted lines between the sequence boundaries represent the separation between lowstand and highstand systems tracts (LST, HST). Note that at Site 1003, the number of turbidites shed during sea-level highstand is twice as high as during lowstand in contrast to Site 1007, at which more turbidites were deposited during sea-level lowstand. The average thickness of turbidite layers is higher during high sea level.
![]()