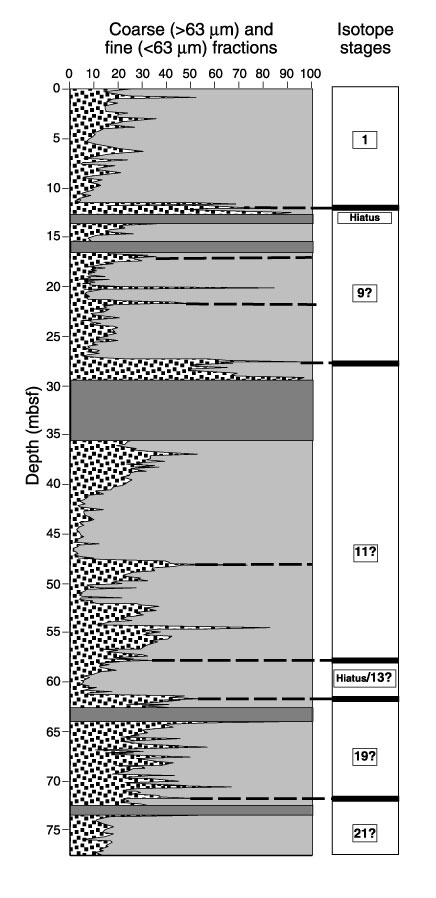
Figure 10. Downcore variations in the percentage of fine and coarse sediment at Site 1003. The dotted pattern represents the coarse (>63 µm) fraction, and the grey pattern represents the fine (<63 µm) fraction. The blocked grey areas represent gaps in the record. The broken black lines tie the peaks to the isotopic "age" model. The numbers between the lines depict the odd (interglacial) isotope stages. The hiatuses are also marked.
![]()