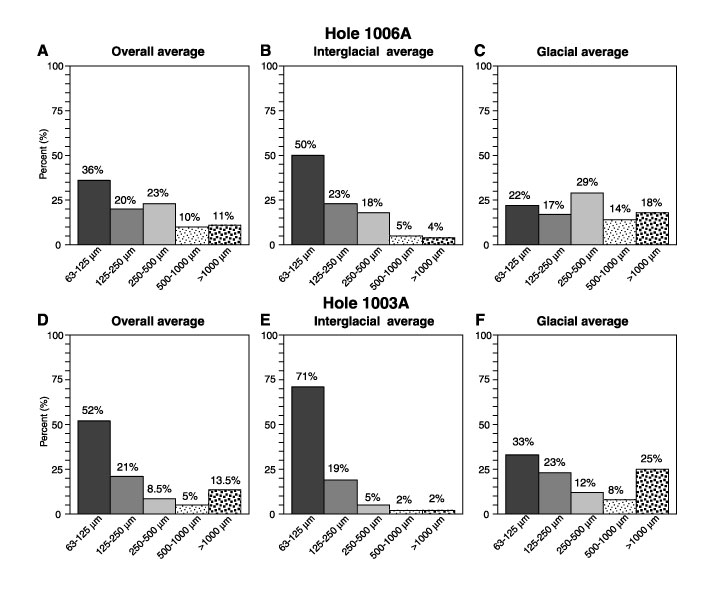
Figure 12. Trends in the relative percentages of the coarse fraction (>63 µm) subdivisions; very fine sand (63-125 µm), fine sand (125-250 µm), medium sand (250-500 µm), coarse sand (500-1000 µm), and very coarse sand, and pebbles (>1000 µm). Histograms A and D show the overall (interglacial and glacial combined) grain-size distributions for the distal site (Hole 1006A) and the proximal site (Hole 1003A), respectively. Histograms B and E show the interglacial trends, whereas histograms C and F show the glacial trends for each of the holes. These trends are based on averages for the extreme values in both the interglacial and glacial periods.
![]()