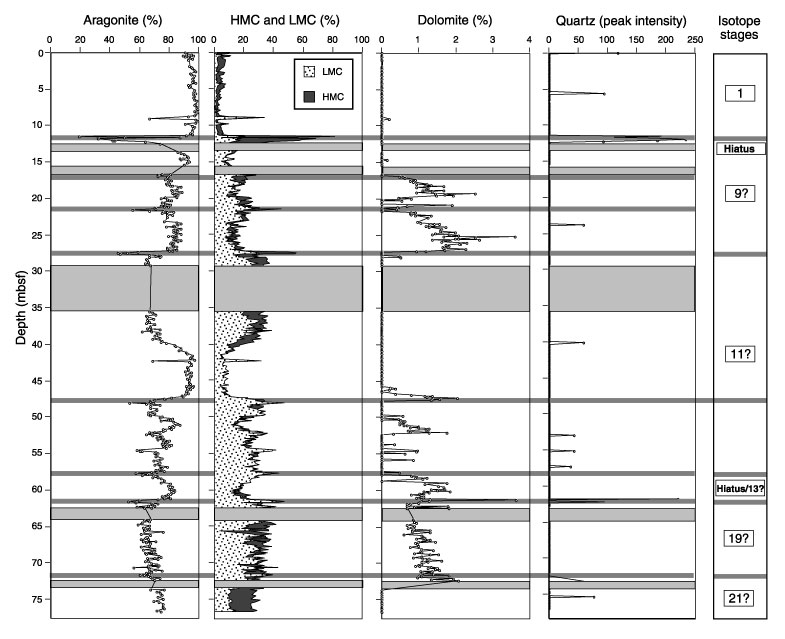
Figure 7. Downcore variations in the relative percentage of aragonite, high-magnesium calcite (HMC), low-magnesium calcite (LMC), and dolomite for the fine fraction (<63 µm) for Site 1003. Downcore variations in the presence of quartz are given as peak intensity. The blocked grey areas represent gaps in the record, and the grey lines indicate the ties between the records and the glacial periods. The isotope stages are also shown, with the odd numbers indicating the interglacial periods (sea-level highstands).
![]()