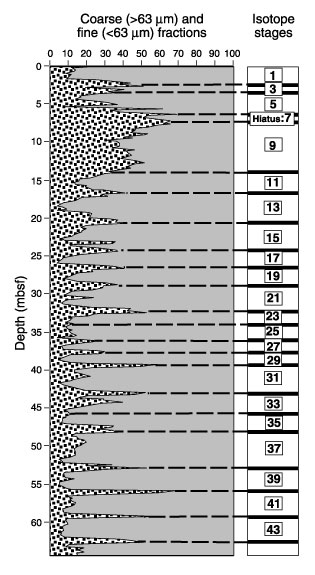
Figure 8. Downcore variations in the percentage of fine and coarse sediment at Site 1006. The dotted pattern represents the coarse fraction (>63 µm), and the grey pattern represents the fine fraction (<63 µm). The broken black lines tie the peaks to the isotopic "age" model. The numbers between the lines depict the odd (interglacial) isotope stages. The hiatus in the upper-core section is marked.
![]()