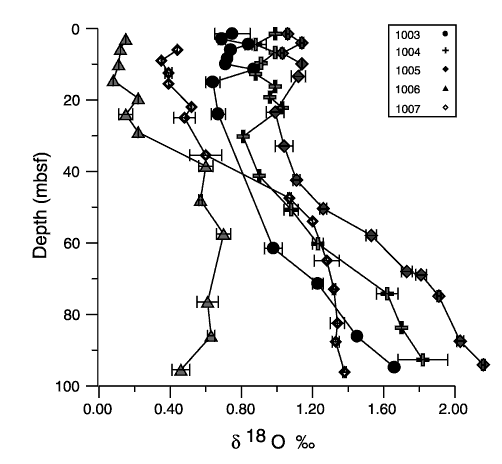
Figure
6. Variations
in the ![]() 18O
of the pore waters from the upper 100 mbsf, Sites 1003-1007. Note the decrease
in the
18O
of the pore waters from the upper 100 mbsf, Sites 1003-1007. Note the decrease
in the ![]() 18O
of the pore fluids at Sites 1004 and 1005 corresponding to the decrease seen in
the Cl-.
Error bars represent ±1 standard deviation.
18O
of the pore fluids at Sites 1004 and 1005 corresponding to the decrease seen in
the Cl-.
Error bars represent ±1 standard deviation.

![]()