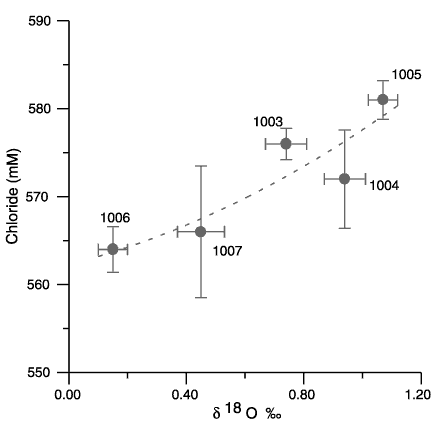
Figure
7. Mean
chloride concentrations and ![]() 18O
values for the upper 30 mbsf, Sites 1003-1007. Note the decrease in the
18O
values for the upper 30 mbsf, Sites 1003-1007. Note the decrease in the ![]() 18O
as the sites become farther from the platform margin. Chloride data are from
Eberli, Swart, Malone, et al. (1997). Error bars represent ±1 standard
deviation of the mean of the values in the upper 30 mbsf.
18O
as the sites become farther from the platform margin. Chloride data are from
Eberli, Swart, Malone, et al. (1997). Error bars represent ±1 standard
deviation of the mean of the values in the upper 30 mbsf.

![]()