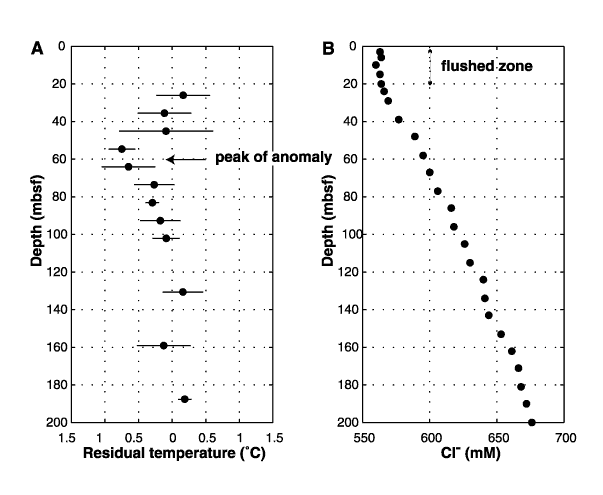
Figure 4. Comparison of the temperature deviation from (A) the linear trend and (B) the chloride concentration profile for Site 1006.