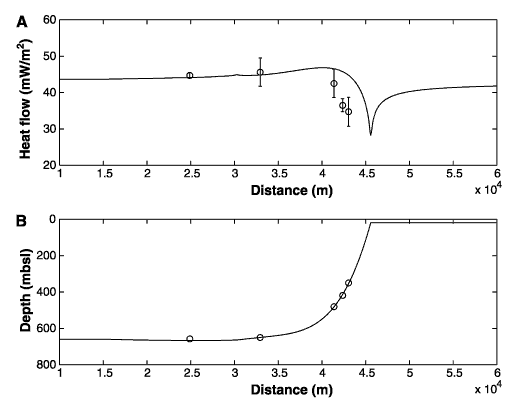
Figure 8. A. Comparison of the heat-flow values predicted by the thermal model that accounts for the topographic effect (solid line) and the heat-flow values determined at Sites 1003 through 1007 (open circles). B. The topographic profile used in the model (solid line) and the seafloor depths of the same drill sites (open circles).

![]()