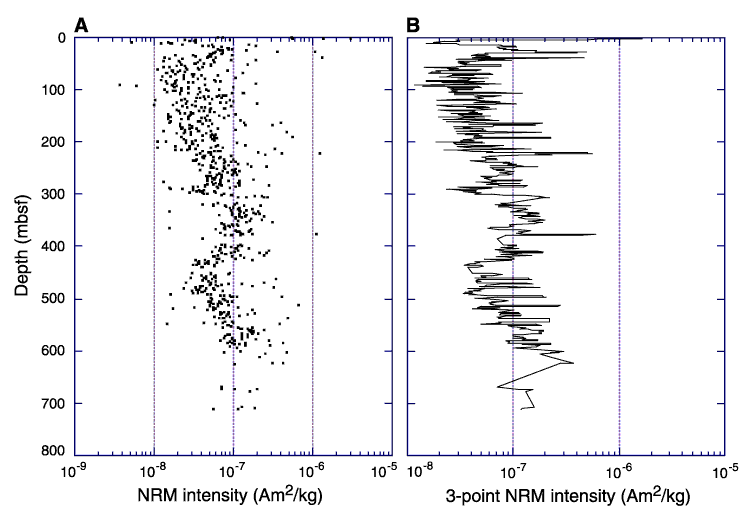
Figure 2. Magnetic intensity at the natural remanent magnetization (NRM) level for Hole 1006A discrete samples. A. Individual data points from discrete samples with a best-fit curve. Variations in NRM intensity are apparent in several intervals of the cored section. B. Three-point smoothing of the magnetic intensity data shown in A.

![]()