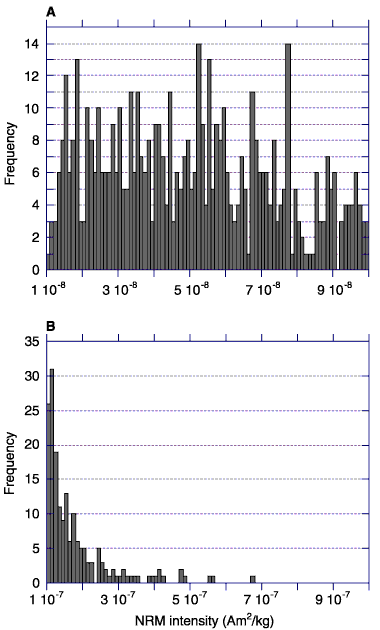
Figure 3. Histogram of natural remanent magnetization (NRM) intensity values for discrete samples. A. Distribution of intensity values between 1 × 10⁻⁸ and 1 × 10⁻⁷ Am2/kg. B. Distribution of intensity values between 1 × 10⁻⁷ and 1 × 10⁻⁶ Am2/kg. Distribution of samples >1 × 10⁻⁷ Am2/kg decreases rapidly. Note change in frequency scale between the two histograms.

![]()