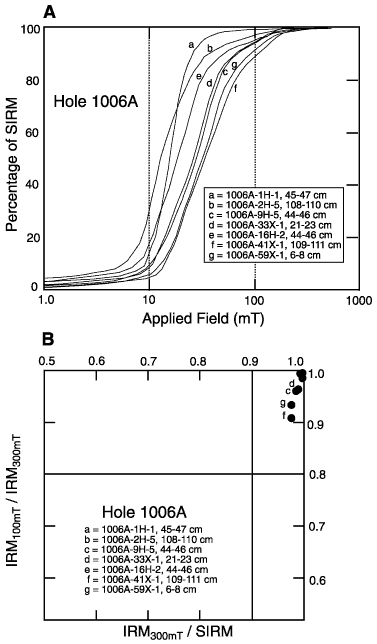
Figure 5. A. Isothermal remanent magnetization acquisition curves for several samples from Hole 1006A. The acquisition patterns are similar to those of single-domain magnetite (samples a, b, and e) or magnetite partially oxidized to maghemite (samples c, d, f, and g), as most samples reach saturation near an applied field of 100 mT. B. Comparison of ratios from the isothermal remanent magnetization (IRM) acquisition data. SIRM = saturation isothermal remanent magnetization. All the samples fall in the upper right portion of the plotóratios characteristic of single-domain magnetite.

![]()