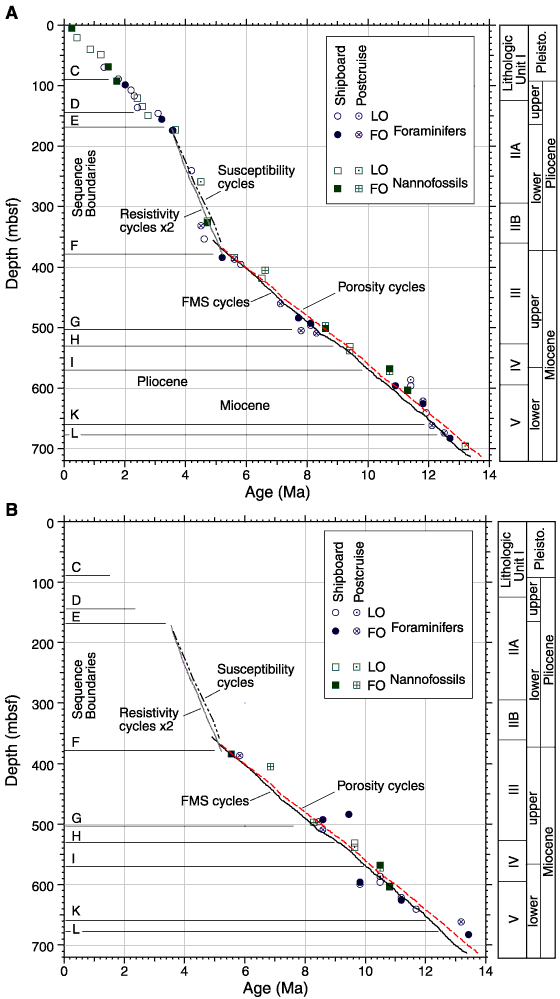
Figure 6. Depth-age plot showing foraminifer and nannofossil data and cycle stratigraphies using (A) Berggren et al. (1995) ages and (B) ODP Leg 154 ages for the bioevents. The bioevents used are given in Table 4, Table 5, Table 6, and Table 7. C-L = sequence boundaries, LO = last occurrence, FO = first occurrence, FMS = Formation MicroScanner. The solid and dashed line represent the predicted age-depth plot by using the cyclostratigraphy of the FMS and porosity cycles. The bioevents at Site 1006 plot reasonably close to the predicted line by applying the Berggren et al. (1995) ages (A), although clear deviations can be seen at ~10-12 Ma. The bioevents at ~10-12 Ma fit much better when the tuned ODP Leg 154 ages are applied, although two events ~13.2 Ma are offset from the line. This is probably caused by problems with taxonomic interpretations.

![]()