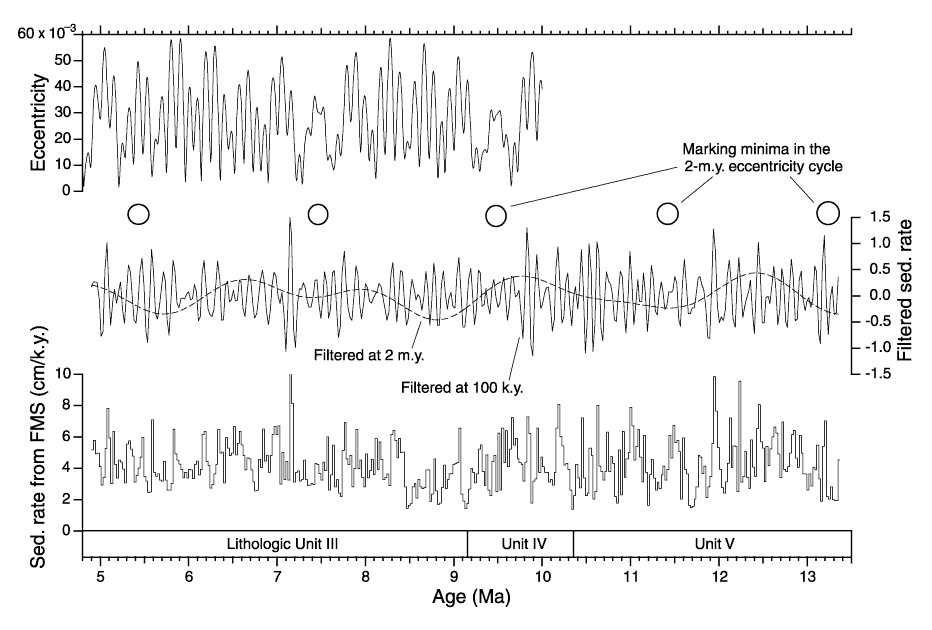
Figure 8. Sedimentation rate variability vs. time. FMS = Formation MicroScanner. The filtered sedimentation rate record shows the occurrences of the short- and long-term eccentricity cycles. Also, the long-term 1.8-m.y. cycle is indicated by the dashed line. The maxima in sedimentation rates are interpreted as periods of high-carbonate platform input onto the upper slope as a consequence of sea-level highstands. The sedimentation rate fluctuations could therefore be interpreted as a sea-level curve throughout the middle-upper Miocene. The observation that the short- and long-term eccentricity cycles are pervasive throughout the record is important.

![]()