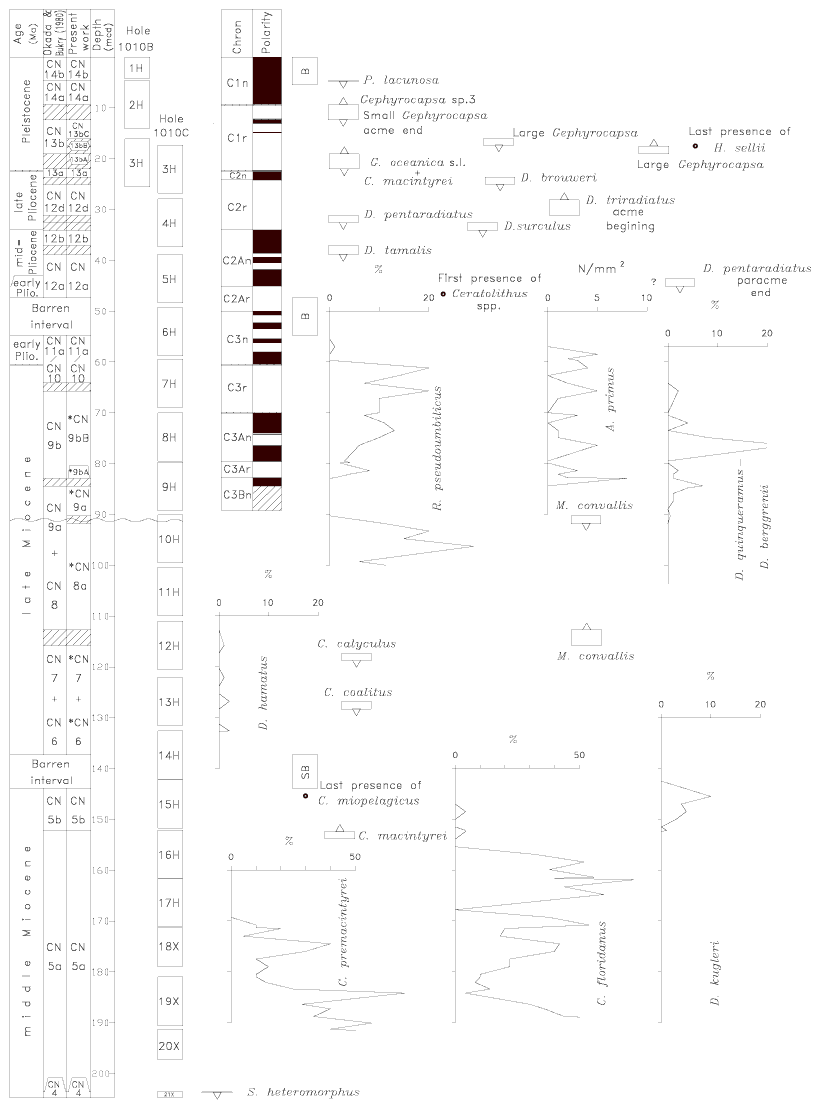
Figure 4. Chronostratigraphy and calcareous nannofossil biostratigraphy at Site 1010. Magnetostratigraphy from A. Hayashida (unpubl. data). In the zonal columns, striped intervals at boundaries represent uncertainties (due to sample spacing) within which biohorizons occur. Striped areas in the chronostratigraphy columns represent intervals within which chronostratigraphic boundaries occur. * = emended zones and subzones. Wavy line = gap. B = barren interval, SB = sub-barren interval. mcd = meters composite depth. N/mm2 = number of specimens per square millimeter. See text for other counting methods.

![]()