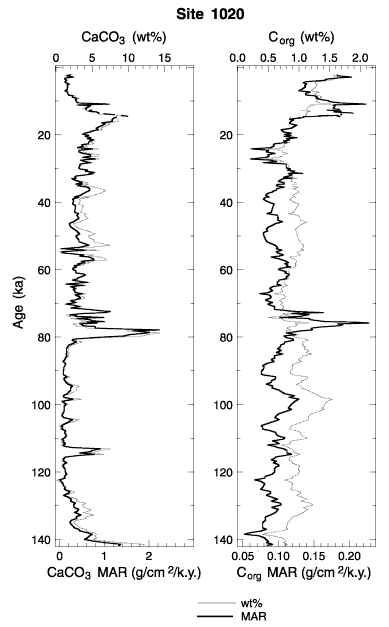
Figure 10. CaCO3 and Corg time series for Site 1020, shown as weight percent and as mass accumulation rate (MAR). This site is more typical of the Leg 167 sites. Sedimentation rates varied by about a factor of two. Because of the large changes in CaCO3 weight percent the MAR and weight percent time series have virtually the same variance, while the Corg MAR time series is significantly affected by both sedimentation rate and changes in weight percent.

![]()