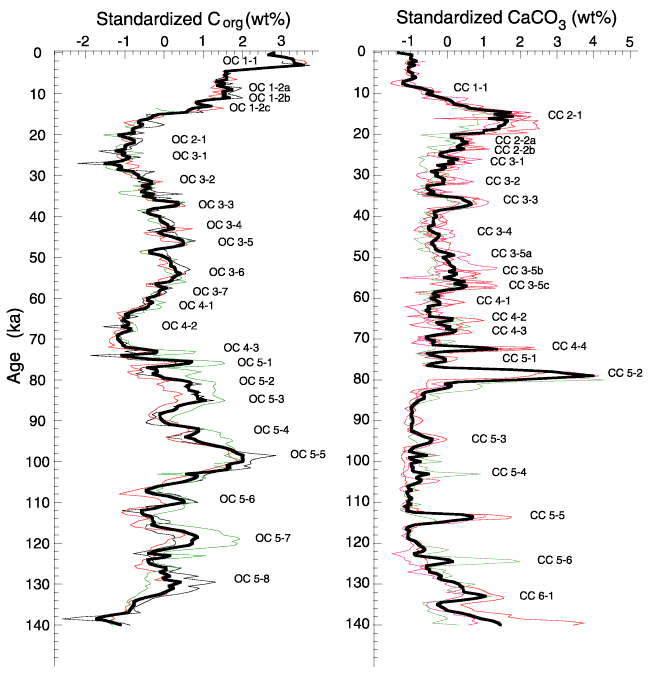
Figure 11. Stack of three Corg weight percent time series (Core EW9504-17, Site 1020, and Site 1018) and four CaCO3 weight percent time series (the three above and Core W8709-13). Bold line = the stacked data; light lines are individual core or site records. Units are standard deviations from the mean of the time series. Named peaks are chronostratigraphic and can be used to correlate between sites.
![]()