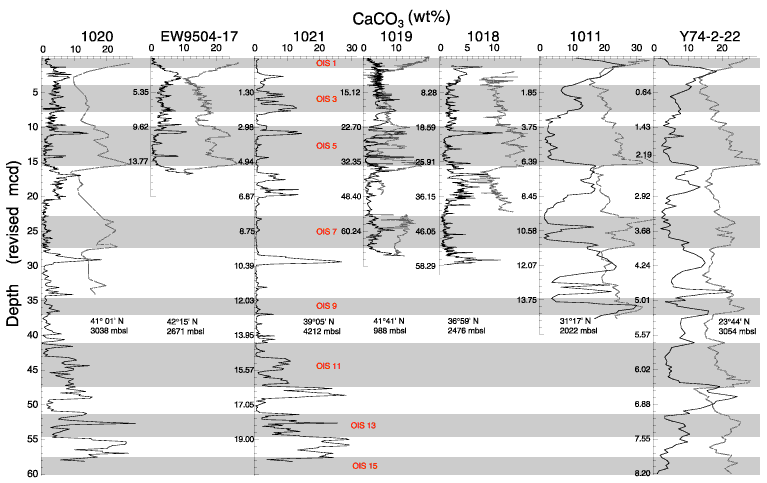
Figure 3. Weight percent CaCO3 profiles in this study shown vs. depth and with benthic oxygen isotope time series superimposed where available. All profiles were originally plotted in Site 1020 equivalent depth derived from the correlations (see text) and then labeled with the local rmcd depth scale.

![]()