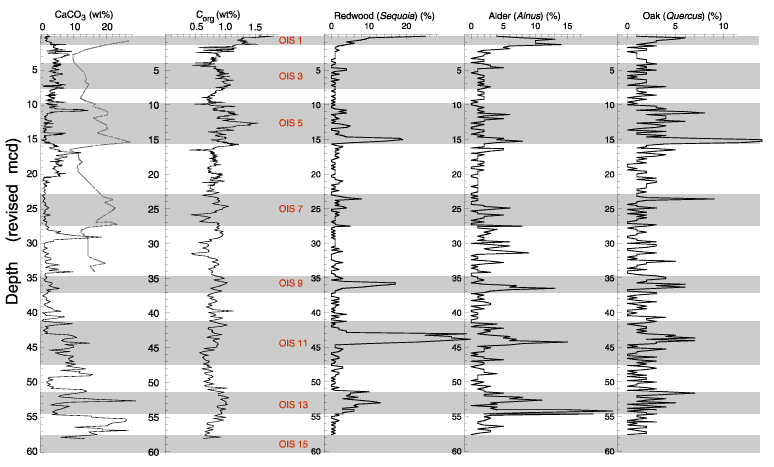
Figure 7. Pollen records from Site 1020 shown with carbon time series; preliminary oxygen isotope control is shown as the gray line with CaCO3. The pollen records were used to mark strong interglacials and develop a preliminary time scale below oxygen isotope control.

![]()