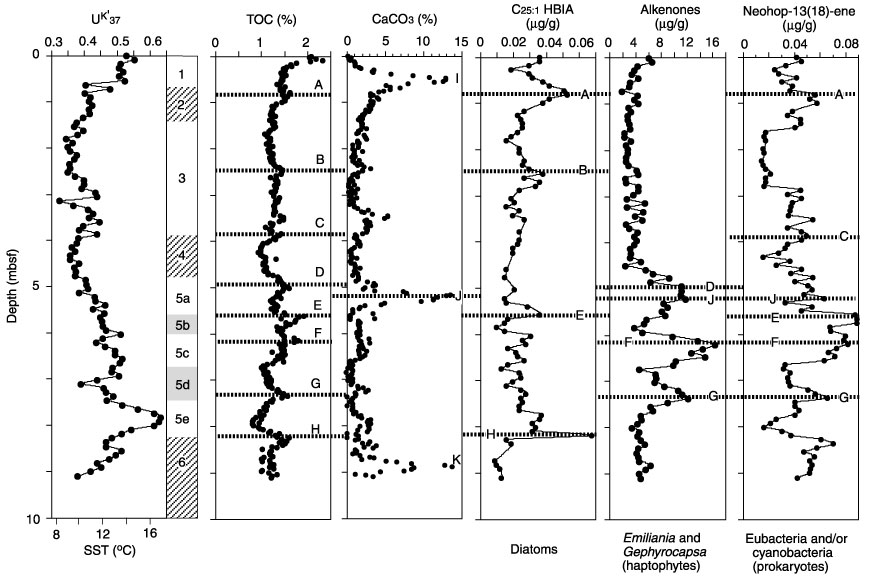
Figure 12. Correlations of TOC and CaCO3 contents with biomarker concentrations in Core 167-1016C-1H. profile is shown in comparison.