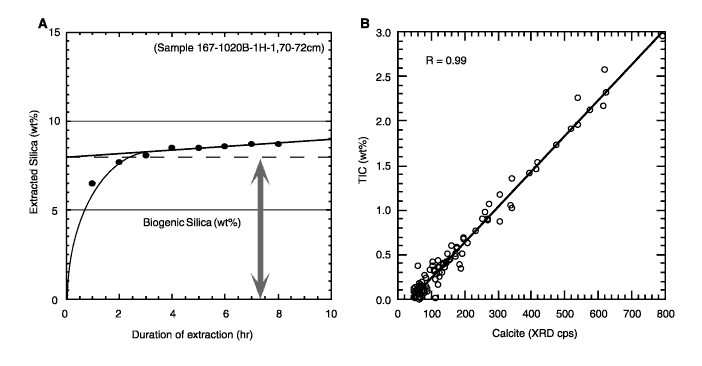
Figure 2. A. Extraction curve of silica for Sample 167-1020B-1H-1, 70-72 cm. The high extraction rates during the early stage of alkali extraction represent biogenic silica such as diatom and radiolarian opal. Biogenic silica concentration in each sample was determined as the y-axis intercept after fitting a line for the low extraction rate of detrital silica (Mortlock and Froelich, 1989). B. Correlation between the intensity of the calcite (001) peak from X-ray diffractometry (XRD) and content of total inorganic carbon (TIC) of 96 samples from Hole 1020B. Biogenic carbonate was determined as CaCO3 and calculated by TIC x 8.34.

![]()