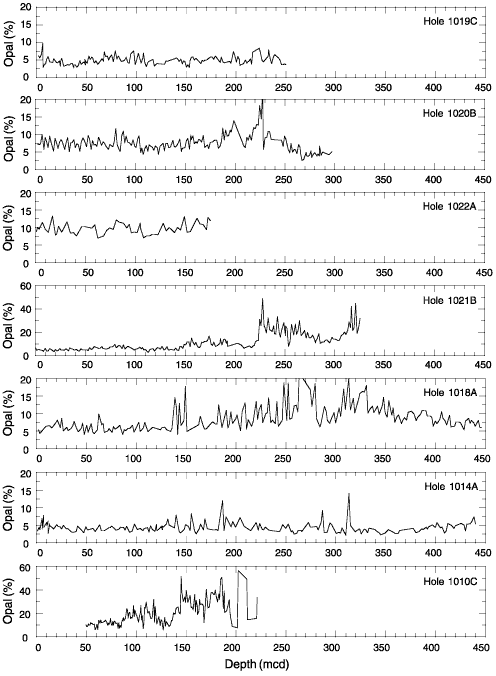
Figure 1. Biogenic opal concentrations vs. depth for a latitudinal transect of seven Leg 167 sites along the California margin (see the "Explanatory Notes" chapter in Lyle, Koizumi, Richter, et al. [1997] for details on the meters composite depth [mcd] scale). The sites are plotted from south (bottom plot) to north. Note that Sites 1010 and 1021 have different y-axis (opal percentage) limits.

![]()