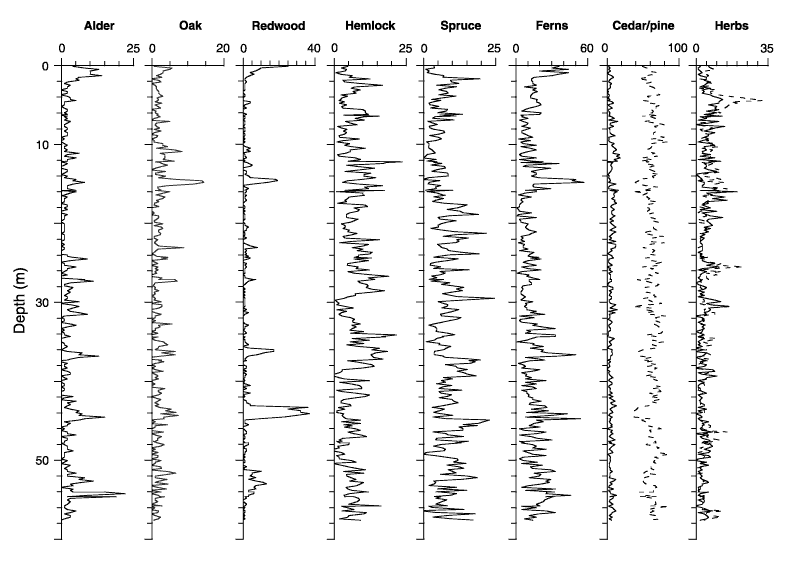
Figure 5. Depth plots of percentages of selected pollen types from the upper 60 m of Holes 1020C and 1020D. The relative abundance of sage (Artemisia) is shown as a solid black line in the herbs plot; other herb percentages are shown by a dotted line. The percentage of cedar is a solid black line; pine is plotted with a dotted line. Note that scales vary for different taxa.

![]()