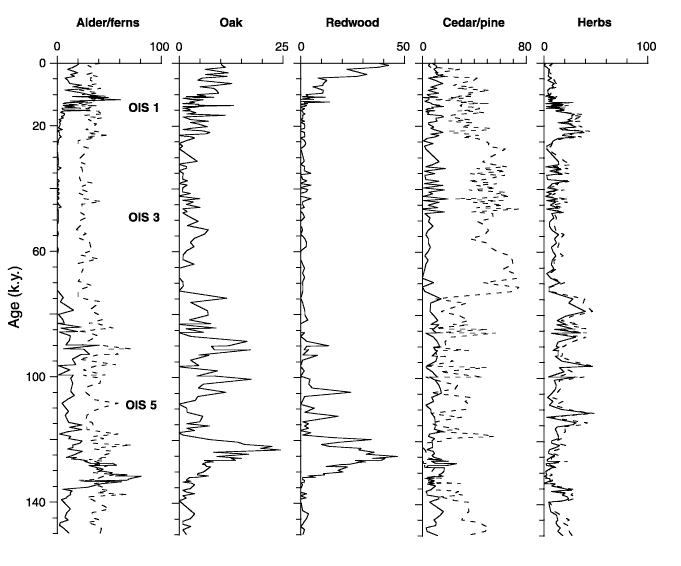
Figure 7. Time series of selected pollen types from Hole 1019C/E and Core EW9504-17 with benthic OISs 1 through 5 superimposed. This preliminary time series is based on the initial time scale developed by Lyle et al. (Chap. 32, this volume). Percentages of ferns, pine, and herbs (excluding sage, which is shown as a solid line in the herbs plot) are shown as dotted lines. OIS = oxygen isotope stage.

![]()