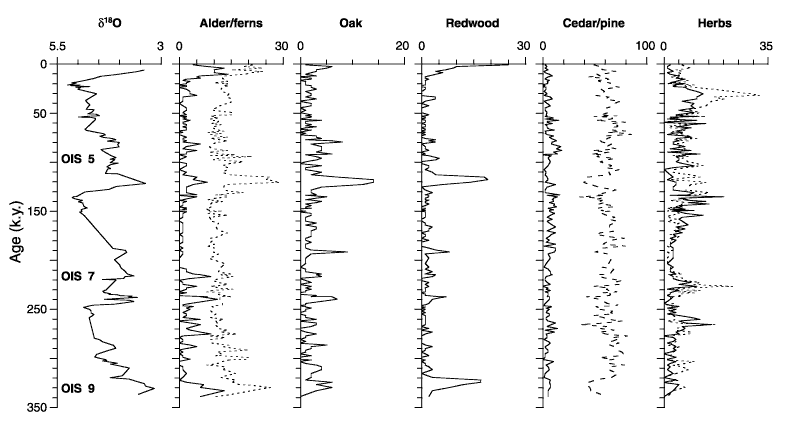
Figure 8. Time series of selected pollen types and preliminary stable isotope data from Holes 1020C and 1020D with benthic OISs 1 through 9 superimposed. Percentages of ferns, pine, and herbs (excluding sage, which is shown as a solid line in the herbs plot) are shown as dotted lines. OIS = oxygen isotope stage.

![]()