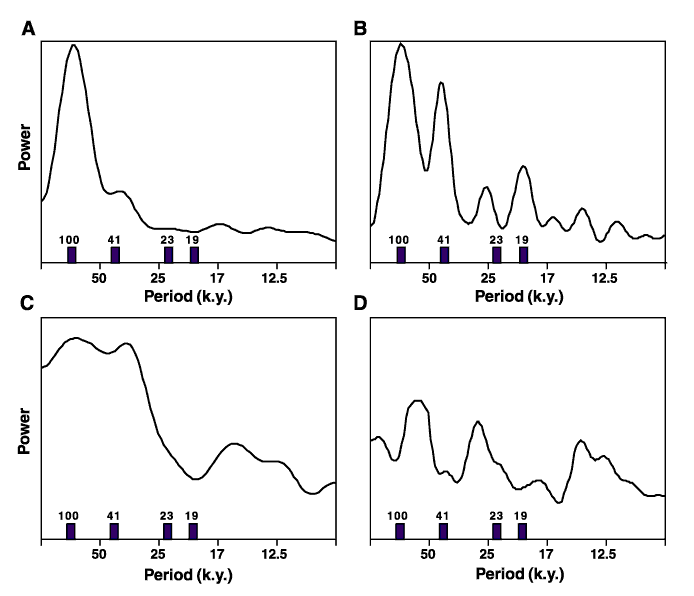
Figure 3. Power spectra calculated from the unsmoothed terrigenous flux time series for (A) Site 1018 and (B) Site 1020 shows significant variability at major orbital periodicities. Terrigenous grain-size data from (C) Site 1018 and (D) Site 1020 display much higher frequency variability and no obvious relationship to orbital cycles. Blackman-Tukey spectral analysis performed using Analyseries software package. Bandwidth is 0.009752 with a time step of 2 k.y. and 87 lags.

![]()