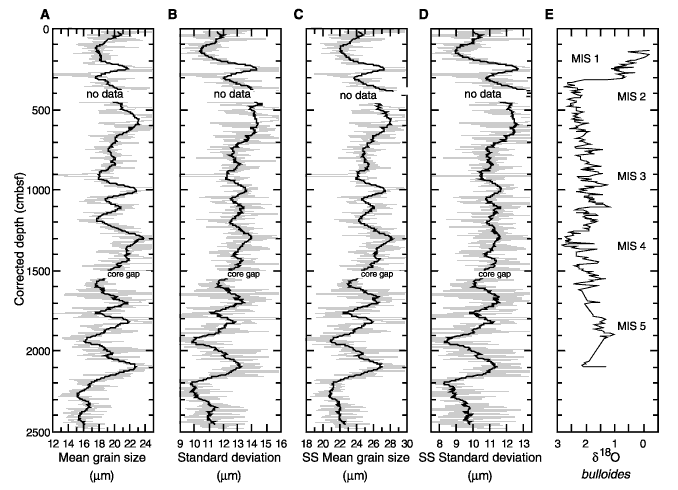
Figure 3. Mean grain size and standard deviation with 21-pt. running averages for Hole 1017E vs. depth. A, B. Entire measured spectrum. C, D. Sortable silt (SS) (10-63 Ám). E. Oxygen isotopes of planktonic foraminifers (Kennett et al., Chap. 21, this volume).

![]()