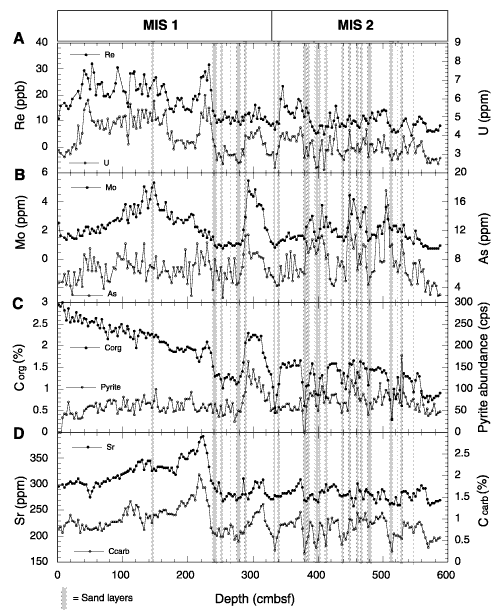
Figure 3. Depth profiles of (A) Re, U; (B) Mo, As; (C) organic carbon, pyrite abundance; and (D) Sr, carbonate carbon concentrations. Sand layers and patches based on visual core description and observation on X-ray radiographs by Tada et al. (Chap. 25, this volume) are indicated by the shaded bands in the profiles. The marine isotope stage (MIS) boundary (top panel) is based on Kennett et al. (Chap. 21, this volume).

![]()