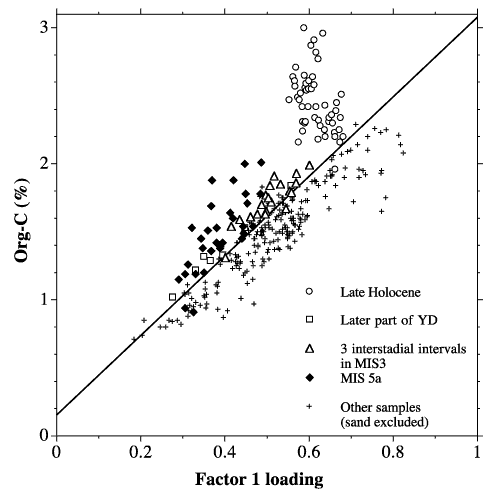
Figure 14. A diagram showing the relationship between factor 1 loading and org-C for samples from the top 15 m of Hole 1017E. The samples from six stratigraphic intervals that scatter the larger org-C side of the regression line are indicated by different symbols.

![]()