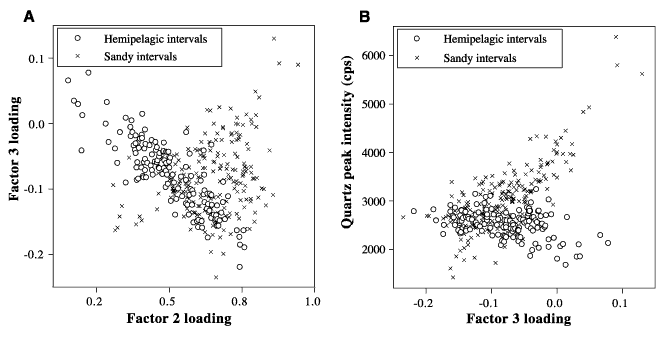
Figure 8. Diagrams showing the relationship between (A) factor 2 loading and factor 3 loading and (B) factor 3 loading and quartz peak height for samples from the top 15 m of Hole 1017E. In both diagrams, samples from sandy intervals (details in the text) show positive correlations whereas samples from hemipelagic intervals show negative correlations.

![]()