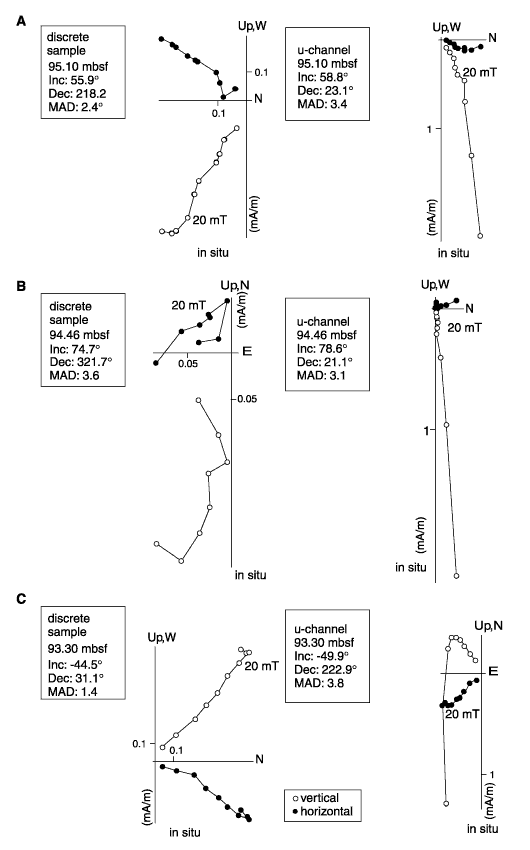
Figure 2. Comparison of representative AF-demagnetization diagrams for samples around the upper Jaramillo transition at Hole 1020C. U-channel measurements (right side) and discrete samples (left side) are from the same depth intervals. MAD is the maximum angle of deviation when fitting a straight line segment to the demagnetization data. (A) Directions before the transition, (B) transitional directions, and (C) directions after the upper Jaramillo reversal. Declinations of u-channels and single samples are different by ~180× because they are from opposite halves of the core.

![]()