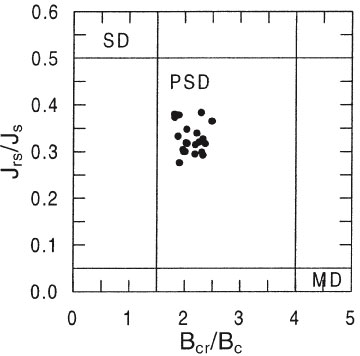
Figure 8. Plot of the hysteresis parameters Jrs/Js vs. Bcr/Bc after Day et al. (1977). There is a tight cluster within the pseudo-single-domain (PSD) size range from the B-M and upper Jaramillo transition at Site 1020. Samples are from the two depth intervals shown in Figure 3 and Figure 5. SD = single domain, MD = multidomain.
![]()