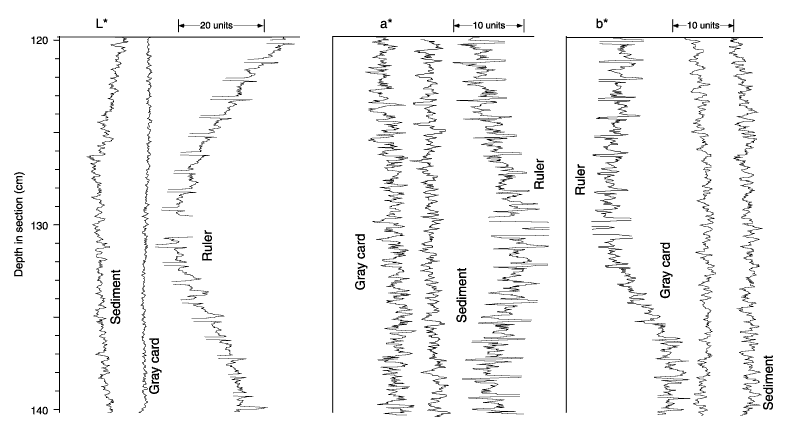
Figure 2. Examples of raw line-scan data through sediment and ruler in an image from Section 167-1019C-1H-1 and through a dull gray card, to illustrate how reflectivity of a surface influences the color distribution across the image. Curves are at the same scale in each variable but have been offset from the actual values for ease of interpretation.

![]()