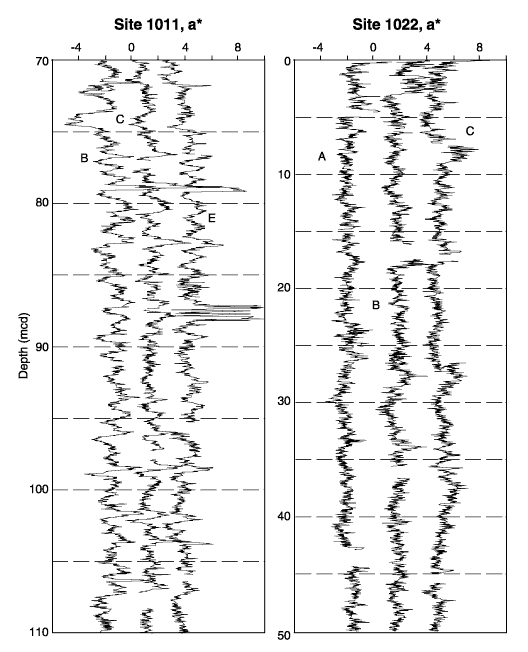
Figure 3. Examples of a* records in two intervals to illustrate visually that analytical precision is good enough to register even a low-amplitude signal consistently. Data for Holes 1011B and 1022A are at their original a* scale; the other holes (Holes 1011C, 1011E, 1022B, and 1022C) have been offset by three units. Note that the horizontal scale is the same in both plots.

![]()