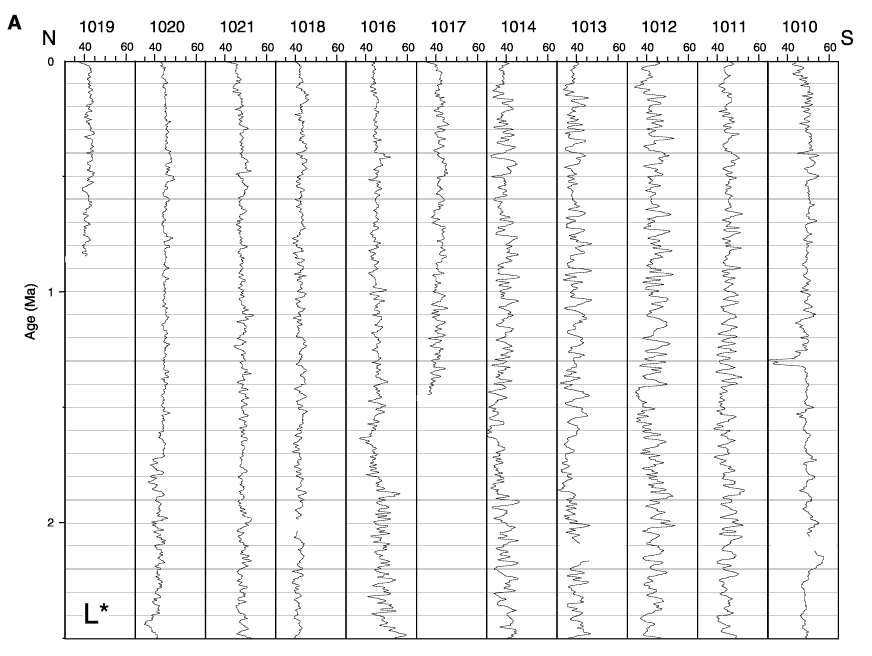
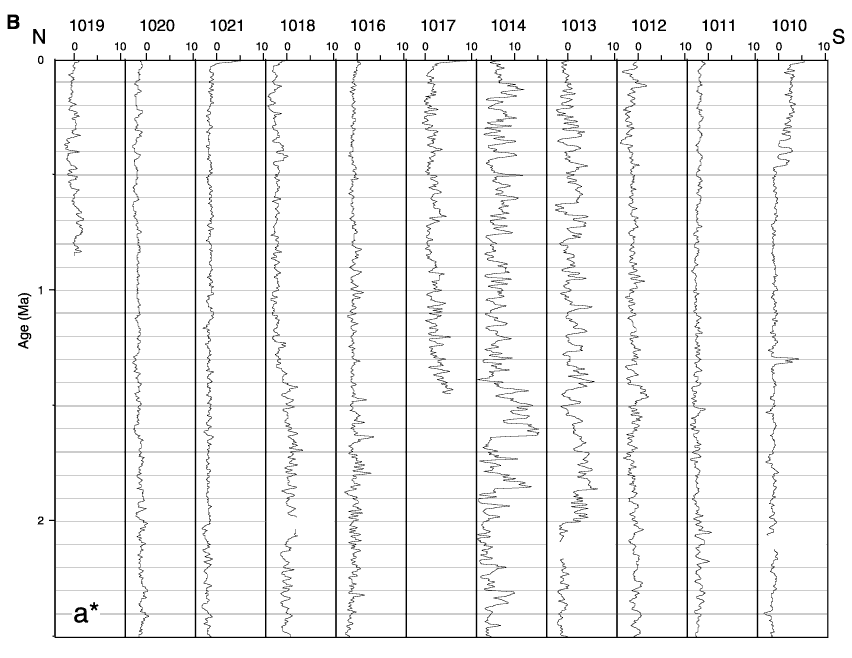
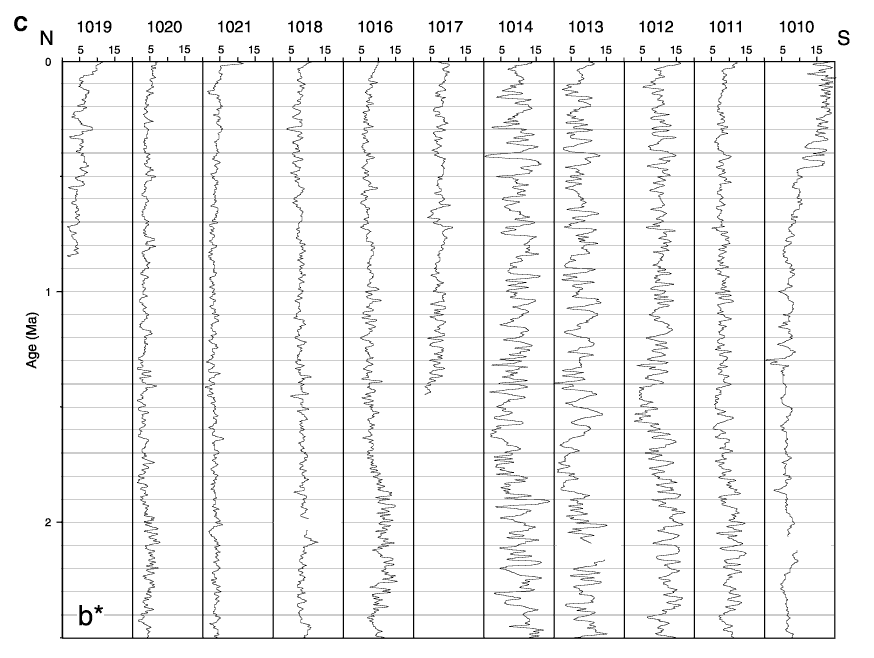
Figure 5. Color records against age for the last 2.5 m.y. in all sections arranged by latitude. A. L*. B. a*. C. b*. Average values were calculated over all data points in a 2-ka slice, and the resulting time series was smoothed with a 3-pt. unweighted running average. Note that horizontal scale in each color variable is the same for all sections, but that the intersect is different for Site 1014, to illustrate how amplitude of the signal varies between sites.


![]()