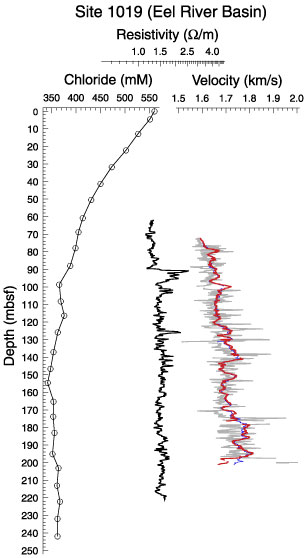
Figure 17. Velocity and resistivity profiles compared to Cl- profile. No obvious indications of hydrates can be seen in the logged interval. The velocity profiles have been processed for this synthesis by using the few good traveltime recordings from the log. The light profile is velocity from a differential traveltime between 10´ and 12´ spaced source-receiver pairs. The two solid curves are calculated from the individual traveltime records and the smoothed caliper log, to calculate the extent of the water path within the borehole.
![]()