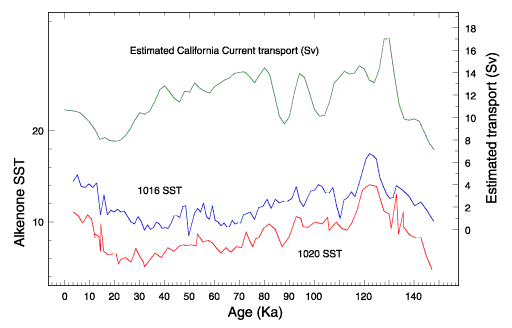
Figure 27. A comparison of SST changes for the last 150 k.y. in the northern California Current (Site 1020; Kreitz et al., Chap. 10, this volume) and the southern California Current (Site 1016; Yamamoto et al., Chap. 12, this volume), showing the coherence of alkenone-estimated SST along the California margin. Changes in California Current transport (sverdrups [Sv], 106 m3/s) calculated from a simple temperature difference model (Doose et al., 1997) are also shown. If the model is correct, lowest California Current flow rates are at the glacial maxima, and highest flow rates are in interglacials.
![]()