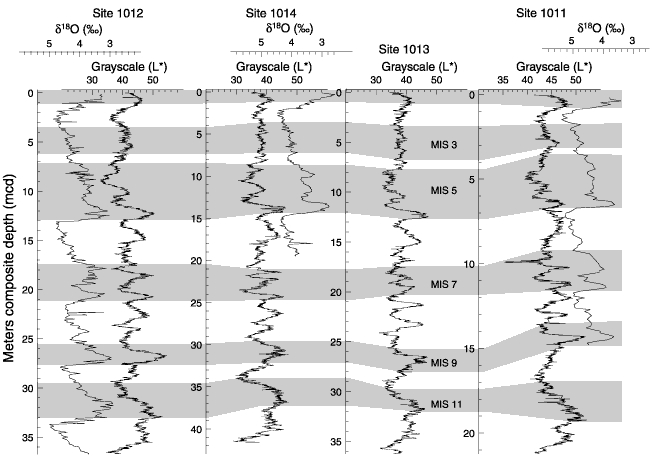
Figure 30. Plots of L*, the grayscale measure in the L*a*b* system vs. depth, and benthic foraminiferal oxygen isotopes at each of the four California Borderlands drill sites. L* data is from Nederbragt et al. (Chap. 29, this volume). Benthic oxygen isotope data are from Andreasen et al. (Chap. 8, this volume) for Sites 1011 and 1012, and Hendy and Kennett (Chap. 7, this volume) for Site 1014. L* ranges between 0 when the color is black to 100 when the color is white. There is clearly a strong and correlatable signal throughout the California Borderlands, providing a fast, simple stratigraphic correlation tool.

![]()