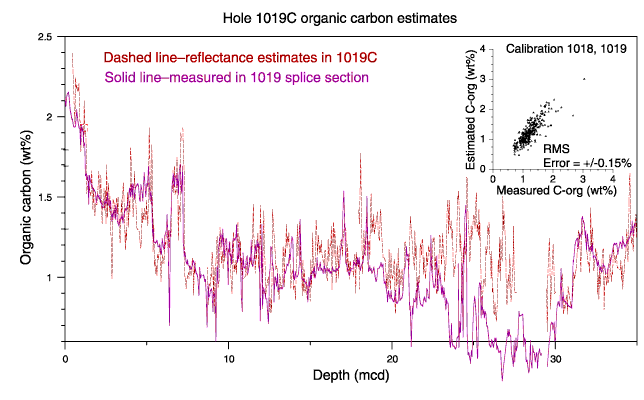
Figure 32. A comparison of the spliced Corg data from Site 1019 (Holes 1019C and 1019E, Lyle et al., Chap. 11, this volume) to an estimate of Corg in Hole 1019C from the OSU SCAT reflectometer. The reflectometer estimate was calibrated with shipboard CaCO3 and Corg analyses.

![]()