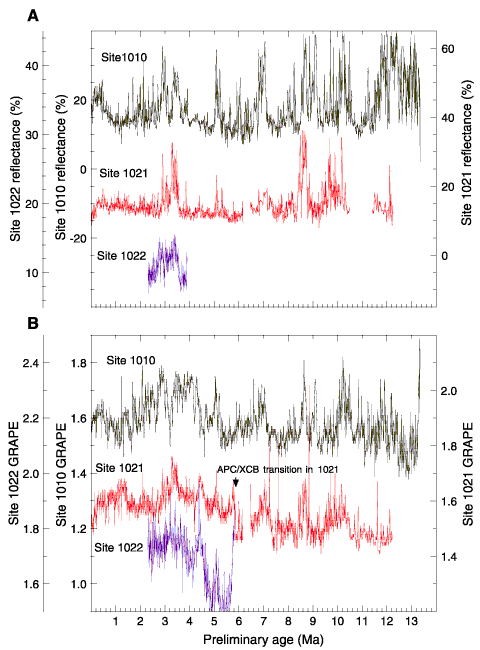
Figure 36. Comparison of (A) OSU SCAT reflectance data for the combined 450-500 nm (blue) channels and (B) GRAPE bulk density depth series from Sites 1010, 1021, and 1022 to show the potential of stratigraphies based upon physical properties.