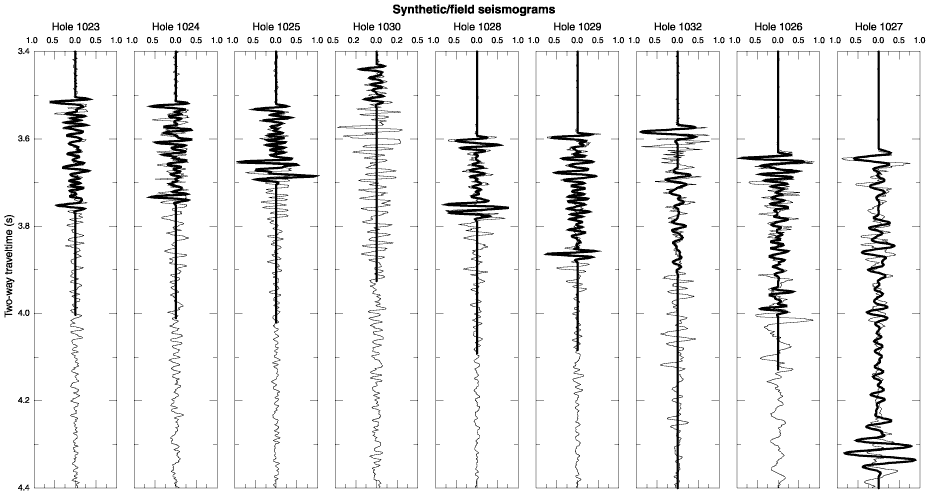
Figure 12. Comparison of field seismic traces (thin line) with synthetic seismograms (thick line) for all nine sites of Leg 168. The density profiles shown in Figure 9 and pseudovelocity profiles shown in Figure 11 are used to generate the synthetic data. For the logged Hole 1032A, downhole Vp log is used.

![]()