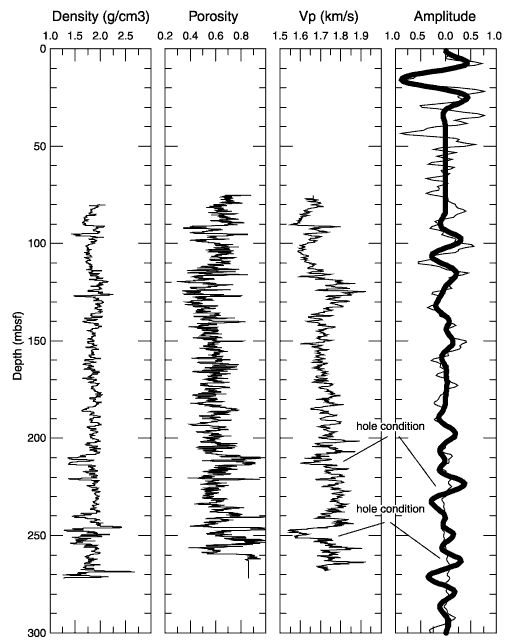
Figure 2. Comparison of field seismic data (thin line) with synthetic seismogram (thick line) generated using log data at Site 1032: HLDS density log, APS neutron porosity log, and SDT sonic velocity. The indicated mismatches are caused by unfavorable hole conditions.

![]()