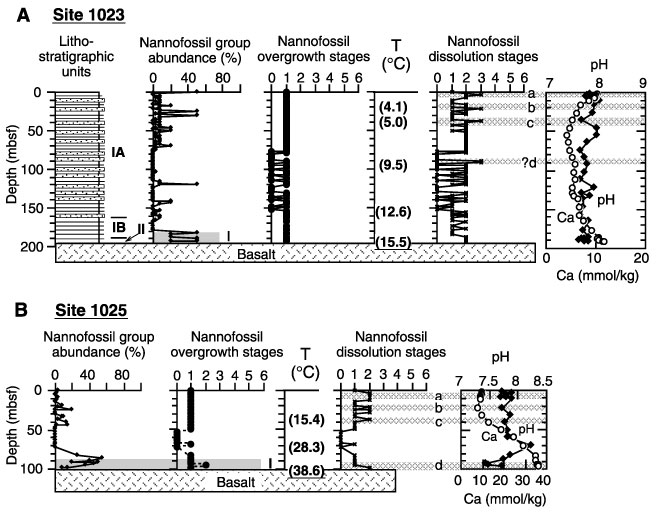
Figure 6. Plots of degrees of nannofossil preservation along Hydrothermal Transition Transect sites. A. Site 1023. B. Site 1025. Reference data of lithostratigraphic units; profiles of carbonate content, calcium, and pH; and data from temperature measurements are from Davis, Fisher, Firth, et al. (1997).
![]()