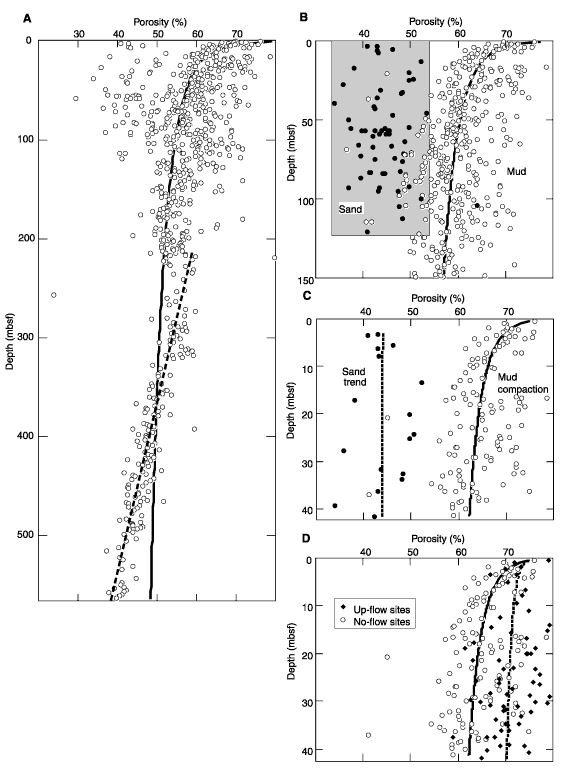
Figure 5. Depth profiles of sediment porosity as determined by shipboard measurements of samples from all sites cored during Leg 168 (Shipboard Scientific Party, 1997b, 1997d, 1997a). A. Complete compilation of data from no-flow sites (Sites 1023-1029), without segregation by lithology. A single compaction curve follows the form n = azb. Note the shift to a linear compaction gradient at ~200 mbsf. B. Comparison of porosity trends for sand and mud lithologies within the upper 150 m at the no-flow sites. Turbidite sands become increasingly sparse below 120 mbsf. C. Comparison of porosity trends for sand and mud lithologies within the upper 42 m at the no-flow sites. D. Comparison of porosity trends for mud lithologies within the upper 42 m at the upflow sites (Sites 1030 and 1031) vs. the no-flow sites. The upflow sites contain mostly hemipelagic mud, whereas the no-flow sites at the same depths contain both hemipelagic and turbidite mud. Compaction curves for the two data sets show a shift of ~7% porosity.

![]()