![]()
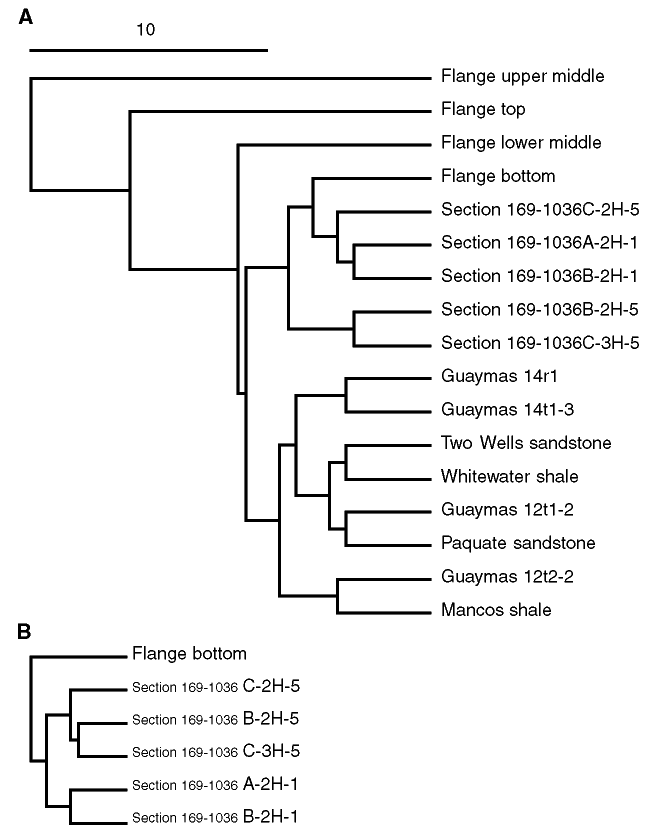
Figure F2. A. Dendrogram of samples in Figure F1, clustered using Euclidean distance (scale bar is 10 units) and average distance linkage. Samples from this study form a group; VLCFAs up to 24 carbons are included. B. Excerpt of subcluster containing Middle Valley samples from cluster analysis using a data set excluding all VLCFA (at the same scale as A).
![]()