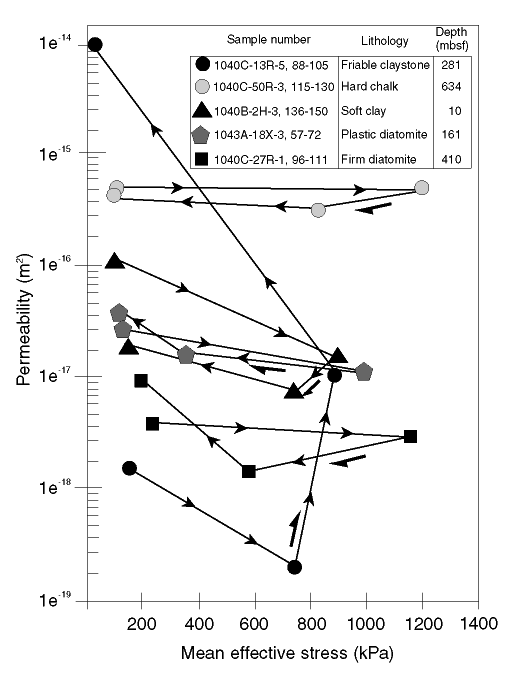
Figure F11. Summary of permeability vs. effective stress relationships both before and after shear. Individual data points connect maximum and minimum values of permeability before and after shear. In all cases bar one (Sample 170-1040C-13R-5, 88-105 cm) changes in permeability are no greater than one order of magnitude.

![]()