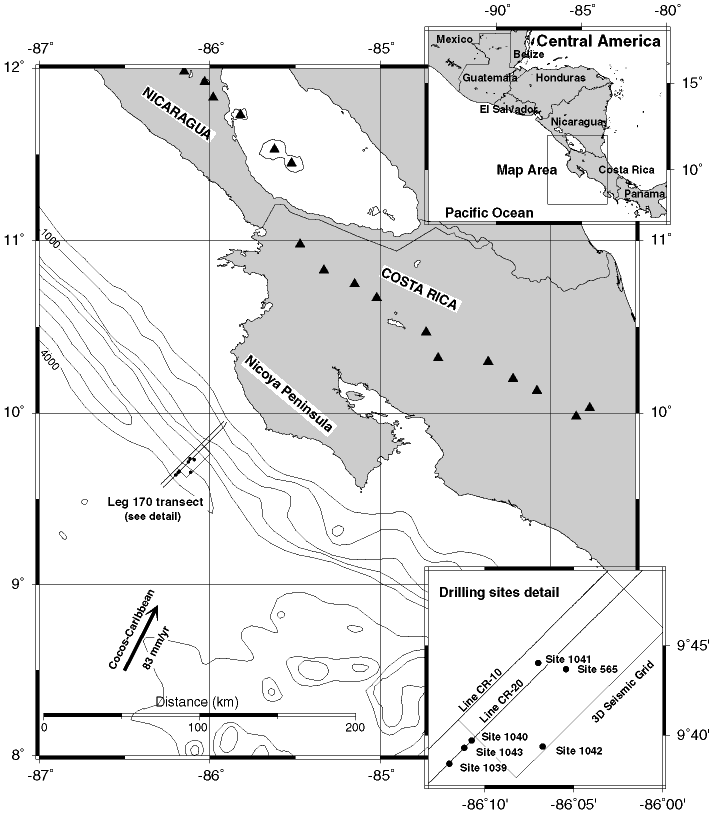
Figure F1. Locations of seismic data and drill sites off northern Costa Rica. The inset on the lower right shows detail of the drill sites. The arrow shows the direction and rate of relative plate motion (DeMets et al., 1994). Triangles onshore = volcanoes. Contour interval offshore = 1000 m.

![]()